
GHG Inventory

Greenhouse Gas Inventory and Disclosure
Since 2022, Daxin has conducted greenhouse gas inventories in accordance with ISO 14064-1:2018. The inventory boundary is consistent with the Company's financial reporting scope, covering headquarters, the Chungke plant, and the Chungkang plant. Subsidiaries are excluded due to the absence of actual operational activities. The operational control approach is used to quantify Scope 1, Scope 2, and Scope 3 emissions, with annual third-party verification conducted and verification statements obtained.
| Item | 2023 | 2024 | 2025 |
|---|---|---|---|
| Scope 1 : Direct Greenhouse Gas Emissions | 1,708 | 761 | 673 |
| Scope 2 : Energy Indirect Greenhouse Gas Emissions | 6,136 | 6,317 | 6,139 |
| Scope 3 : Other Indirect Greenhouse Gas Emissions | 14,175 | 15,576 | 20,003 |
- Unit: metric tons CO₂e.
GHG Verification Statement: ISO 14064-1:2018
- Issued by: DNV
- Organizational Boundary: Same as financial reporting scope, covering HQ, Chungke Plant, and Chungkang Plant; non-operating subsidiaries excluded.
- Verified Emission Scopes: Scope 1, Scope 2, Scope 3
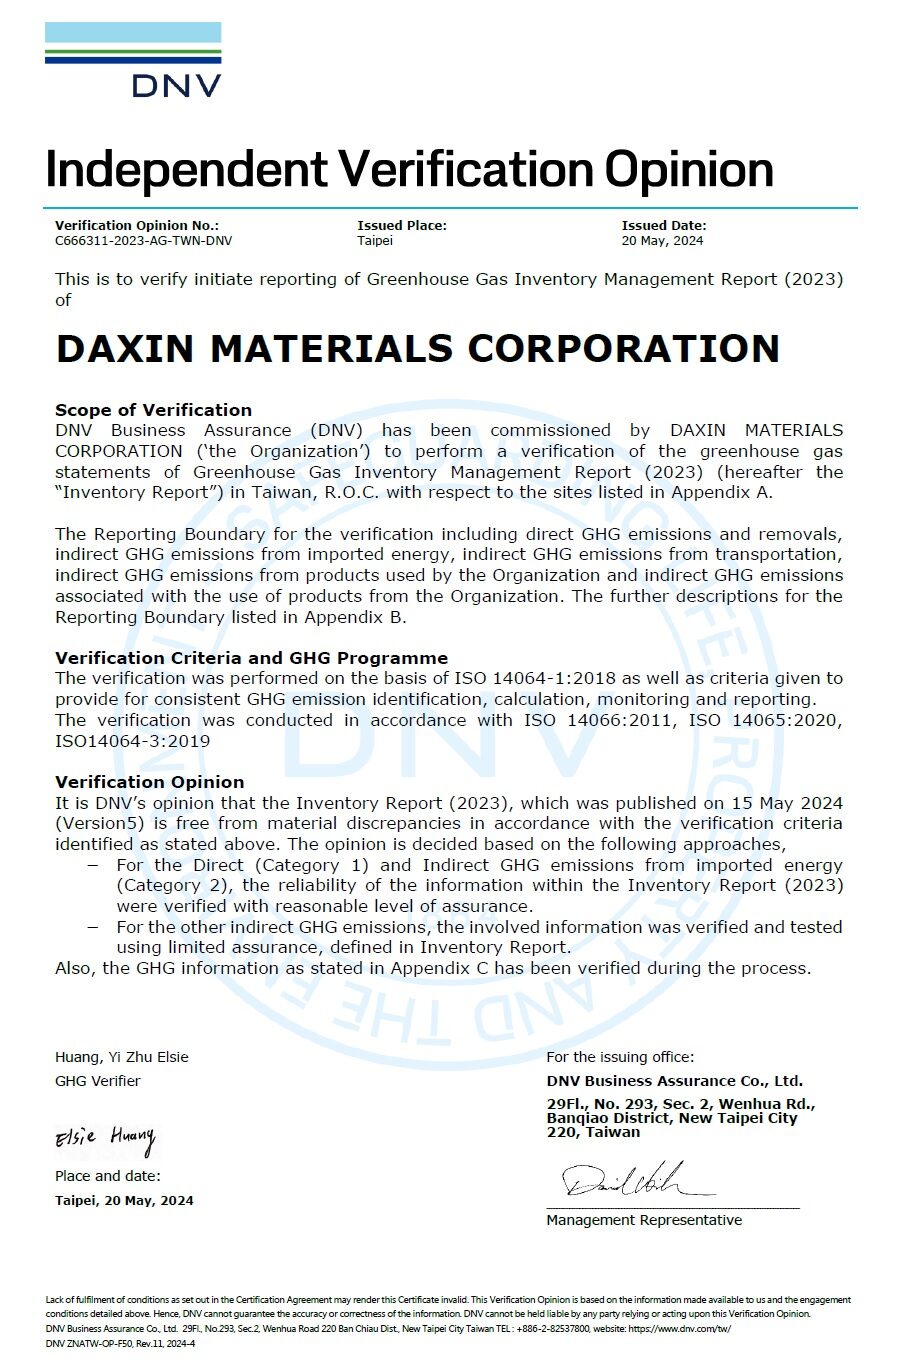
Verification Year: 2023
Issue Date: May 20, 2024
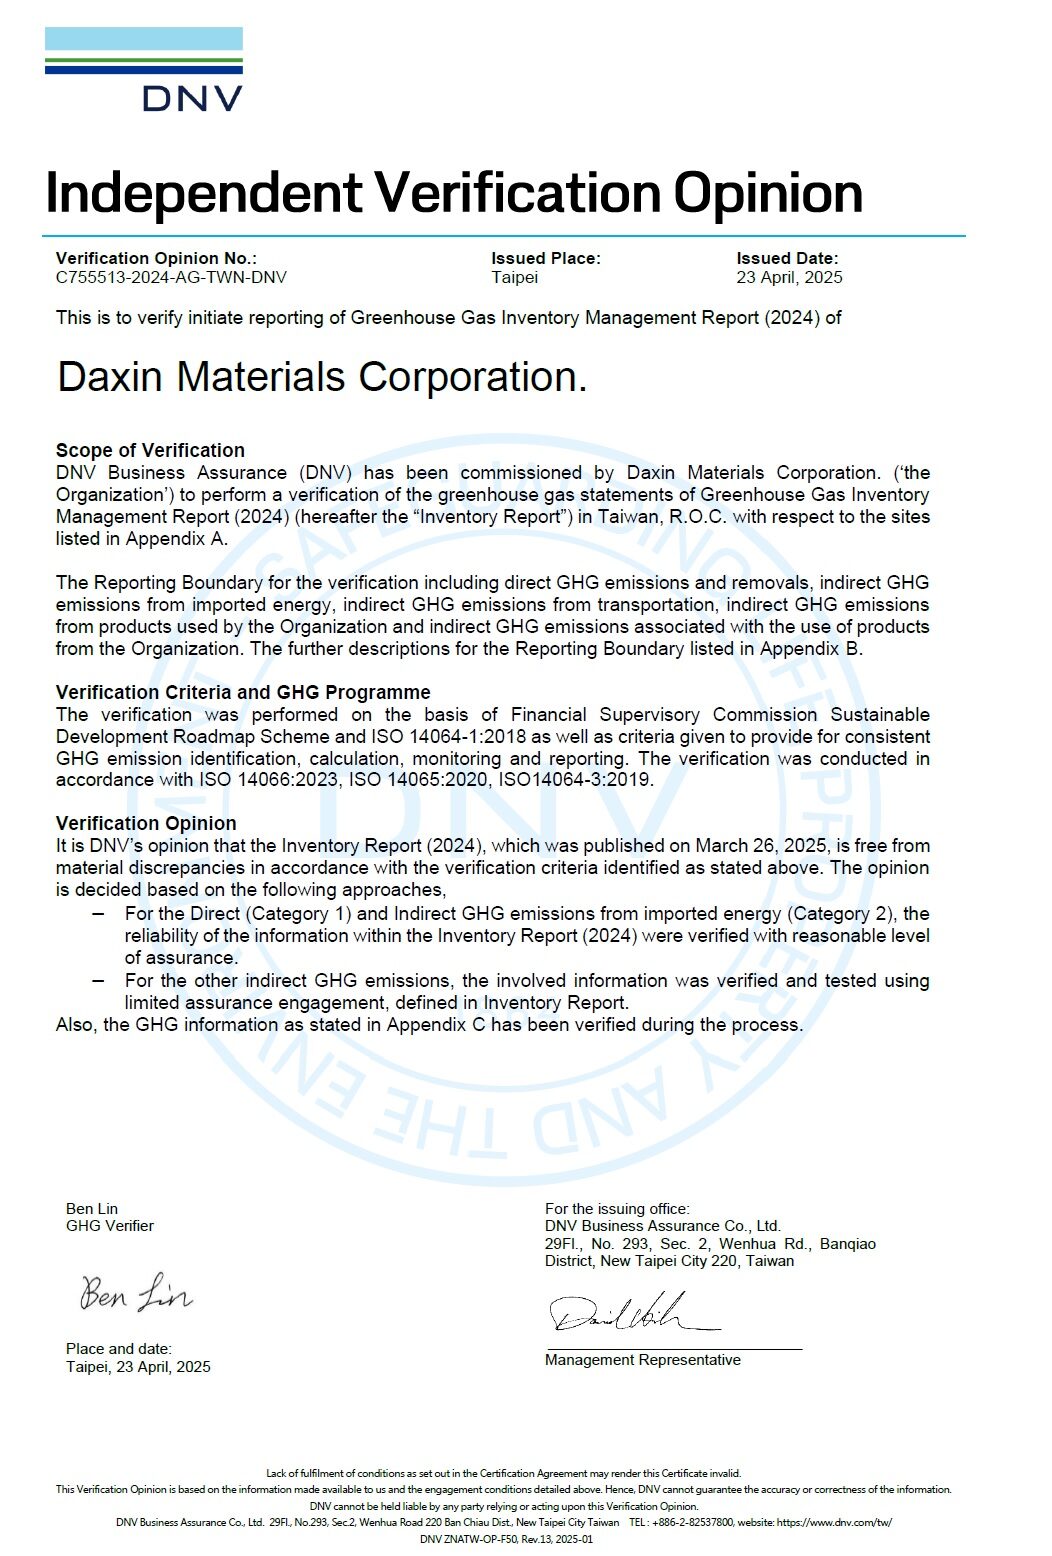
Verification Year: 2024
Issue Date: April 23, 2025
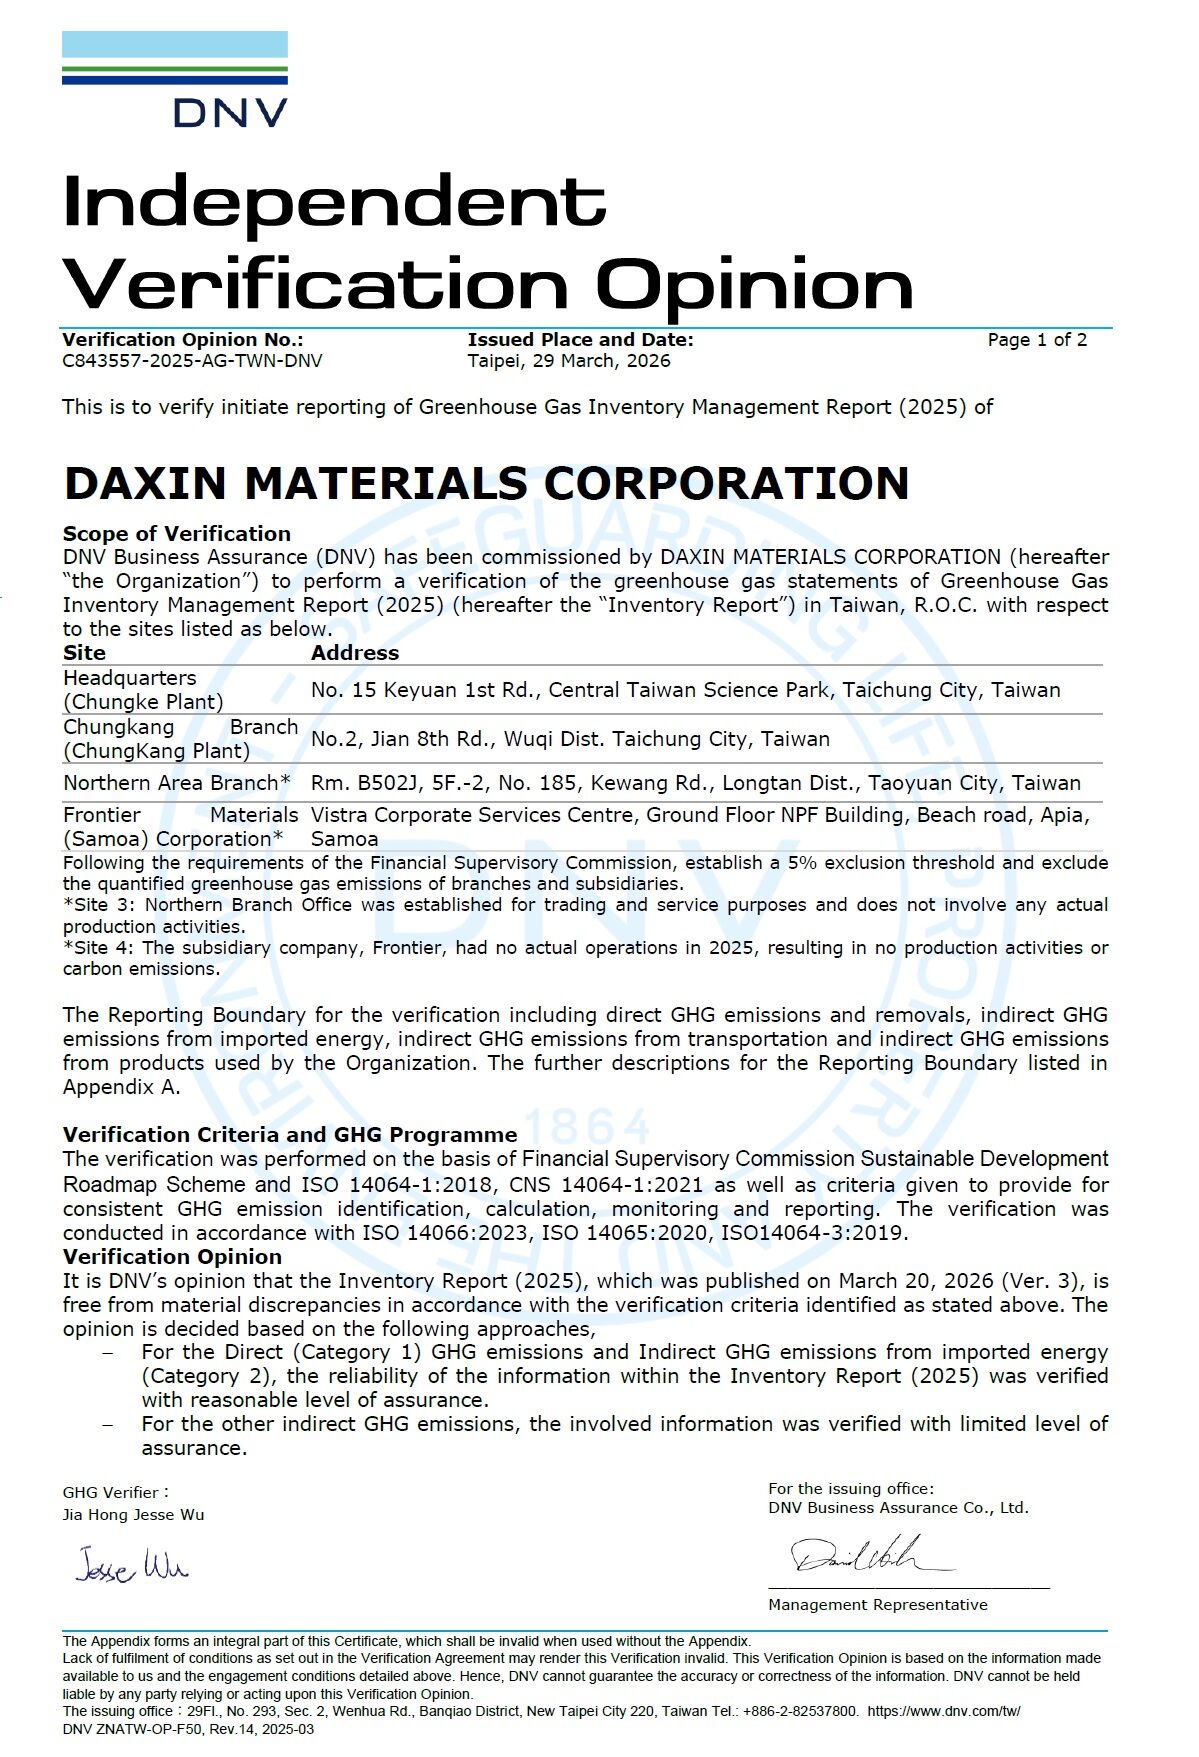
Verification Year: 2025
Issue Date: March 29, 2026
Organizational Operational Emissions (Scope 1 and Scope 2)
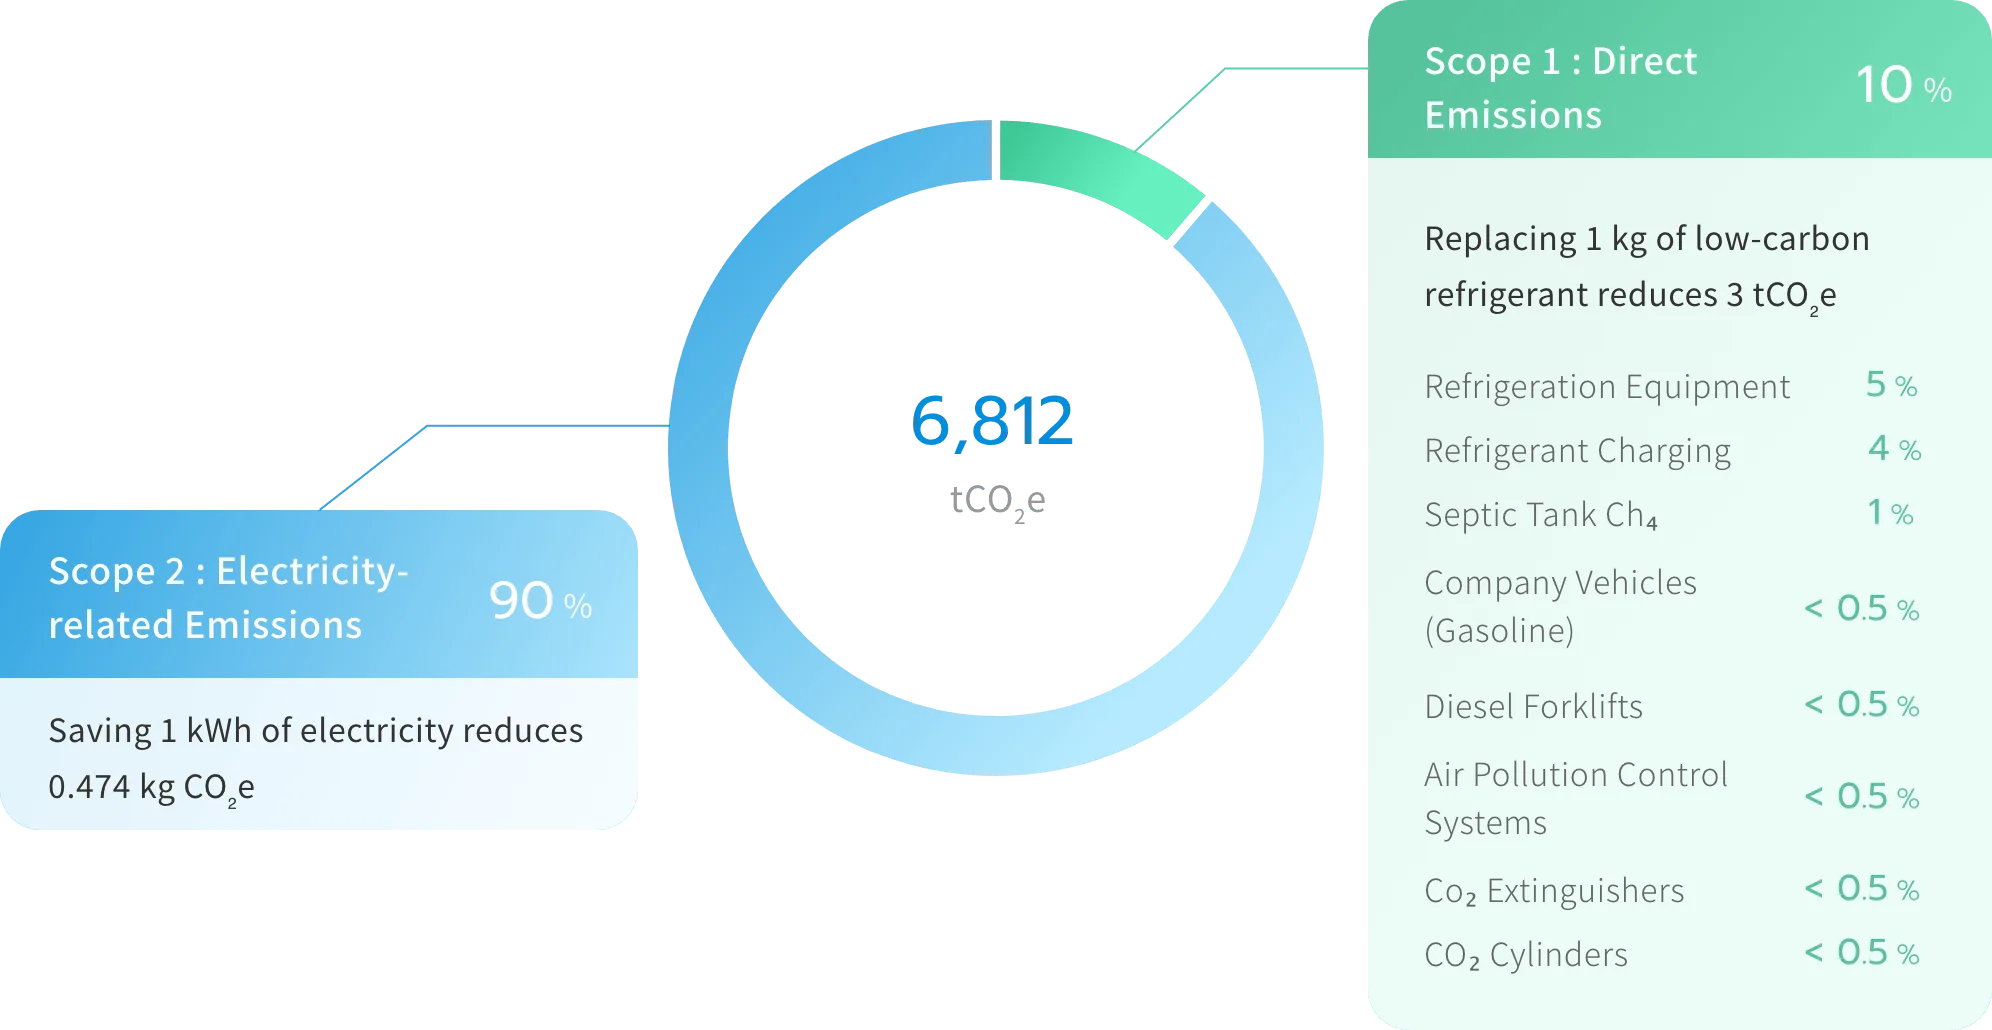
According to the 2025 greenhouse gas inventory, Scope 2 emissions (purchased electricity) account for approximately 90% of total operational emissions and represent the primary emission source. The Company reduces Scope 2 emissions through energy efficiency improvements, on-site solar PV systems, and green power purchase agreements.
Scope 1 emissions (direct emissions) account for approximately 10% of total emissions, primarily from HFC refrigerant leakage in process cooling and refrigeration systems. Given the high global warming potential (GWP) of HFCs, the Company references the COP28 Global Cooling Pledge and relevant regulatory frameworks in Europe and the United States to progressively adopt low-GWP refrigerants, combined with equipment management measures to reduce direct emissions and ensure alignment with mid- to long-term carbon reduction targets.
Scope 1 emissions
673tCO₂e

Scope 2 emissions
6,139tCO₂e

Scope 1 & 2 emissions
6,812tCO₂e

Operational Carbon Management and Carbon Reduction Strategy
2030 Cumulative Electricity Savings Rate
≥15%

2030 Renewable Energy Usage
≥10%

2030 Organizational GHG Emissions Reduction
≥25%

| Strategies | Yr | Targets | Action Plans |
|---|---|---|---|
 Enhancing Energy Efficiency | 2025 | Annual Electricity Savings Rate ≥1.5 % |
|
| 2030 | Cumulative Electricity Savings Rate ≥15 %(2022 - 2030) | ||
 Adoption of Clean Energy | 2025 | RE:100% (Corporate Headquarters) RE : 10% (New Facilities) |
|
| 2030 | RE:10% (Company-wide Operations) | ||
 Development of Low-Carbon Facilities | 2030 | GHG Emissions Reduction ≥25 %(Existing Facilities) |
|