

ESG
Greenhouse Gas & Energy Management
Greenhouse Gas Inventory and Disclosure
Since 2022, Daxin has followed international standards such as The Greenhouse Gas Protocol and ISO 14064-1:2018, adopting the operational control approach to inventory greenhouse gas emissions from facilities under actual operational control, including Daxin and other sites. The company obtains verification statements from third-party verification bodies annually. By fully grasping emission data from its sites and indirect emissions from the upstream and downstream value chain, Daxin continuously improves its greenhouse gas management and carbon reduction actions based on this foundation.
| GHG Emission Verification | 2023 | 2024 |
| Scope 1: Direct GHG emissions | 1,708 | 761 |
| Scope 2: Energy indirect GHG emissions | 6,136 | 6,317 |
| Scope 3: Other indirect GHG emissions | 14,175 | 15,576 |
| 2023 | 2024 |
|
GHG Verification Statement: ISO14064-1:2018 Verification Body: DNV Issuance Date: May 20, 2024 Verified Sites: Chungke and Chungkang plant Verification Year: 2023 Verification Scope: Scope 1, Scope 2, Scope 3 
|
GHG Verification Statement: ISO 14064-1:2018 Verification Body: DNV Issuance Date: April 23, 2025 Verified Sites: Chungke and Chungkang plant Verification Year: 2024 Verification Scope: Scope 1, Scope 2, Scope 3 
|
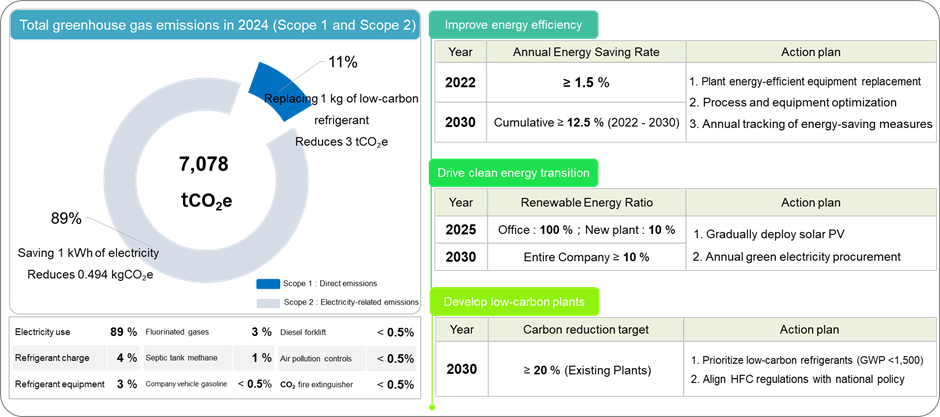
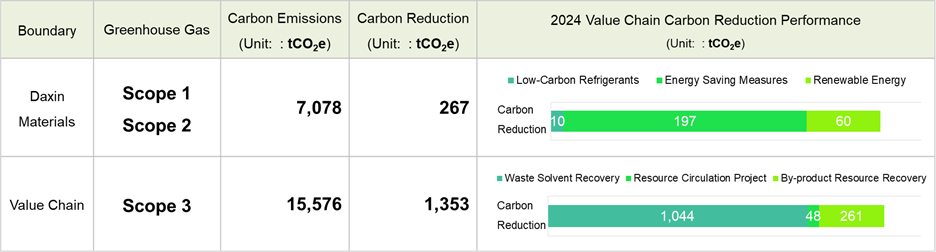
2024 GHG Emissions from Production Sites (Scope 1 and Scope 2)
| Scope 1 (Direct Emissions) | Scope 2 (Energy Indirect Emissions) | Total Emission |
| 761 metric tons CO₂e | 6,317 metric tons CO₂e | 7,078 metric tons CO₂e |
 GHG Emissions Summary for 2024
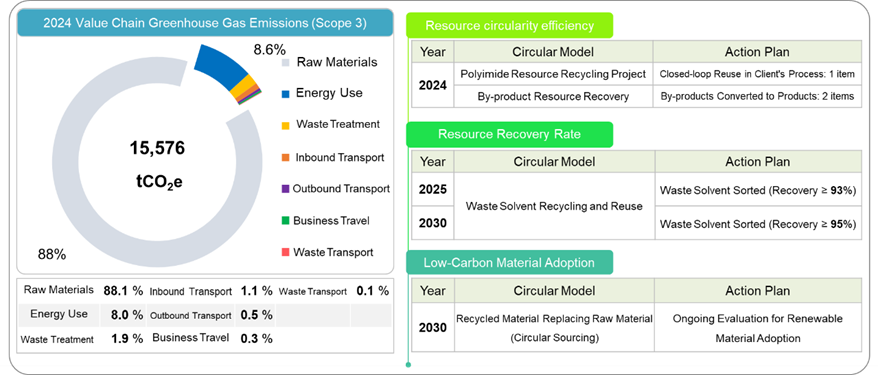
2024 Value Chain Greenhouse Gas Emissions (Scope 3)
In accordance with the ISO 14064-1:2018, significance criteria for indirect emissions were established. A total of seven upstream and downstream value chain emission sources related to the Company’s operations were identified, including four transportation categories and three upstream indirect emission sources, all of which were quantified.
| Scope 3 (Other Indirect Emissions) | 15,576 metric tons CO₂e | |
| Category | Emission Source | Emissions |
| Transportation and Delivery Indirect greenhouse gas emissions | Upstream raw material transportation | 128 |
| Downstream product transportation | 64 | |
| Employee business travel | 45 | |
| Waste transportation | 14 | |
| Indirect greenhouse gas emissions caused by the organization‘s use of products | Raw materials for procurement | 13,729 |
| Waste Disposal | 293 | |
| Fuel/Energy-related activities (excluding Scope 1 & 2) | 1,250 | |
Unit: metric tons CO2e; emission data rounded to the nearest whole number.
2024 Greenhouse Gas (GHG) Reduction Achievements
- Scope 1 – Direct emissions: Reduced by 10 metric tons CO₂e through the adoption of low-carbon refrigerants.
- Scope 2 – Indirect emissions from imported energy: Achieved a reduction of approximately 257 metric tons CO₂e, including 197 metric tons CO₂e from 32 energy-saving measures and 60 metric tons CO₂e from self-consumed renewable electricity generated by solar PV systems.
- Scope 3 – Other indirect emissions: Delivered 1,353 metric tons CO₂e of reduction benefits across the value chain through initiatives such as resource circulation, by-product reutilization, and solvent recovery and reuse (including energy recovery).
- In 2024, these initiatives toward building a low-carbon production site enabled the overall value chain to reduce 1,620 metric tons CO₂e, demonstrating Daxin Materials’ concrete implementation of its climate strategy and actions.
Green Energy Strategic Deployment
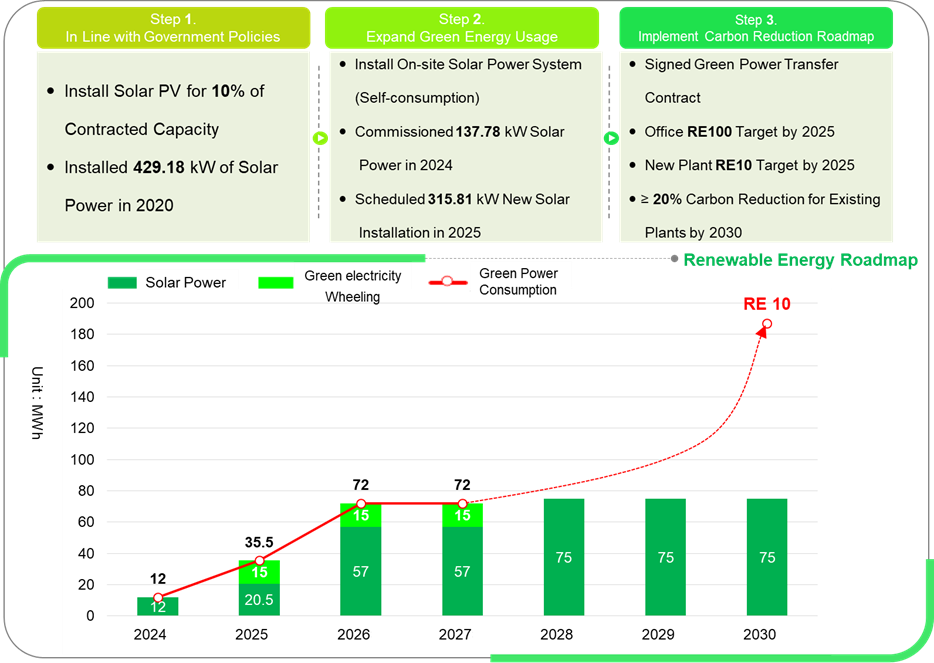
Renewable Energy Usage
Daxin has invested in renewable energy by installing a rooftop solar photovoltaic system at the new plant (Advanced Manufacturing Center II – Daxin Semiconductor Materials Plant) for self-use. In 2024, green electricity generation totaled approximately 120,000 kWh, accounting for 0.9% of total company consumption, with the new plant achieving 10.1% renewable energy usage—meeting the RE10 target ahead of schedule.
| Renewable Energy Statistics | Source of green electricity | Estimated Green Power Generation (10,000 kWh/year) | Actual Usage (kWh) in 2024 |
| Self-generated energy (solar energy) | Chungkang plant - Rooftop Solar Power Generation System | 18 | 121,565 |
| Self-generated energy (solar energy) | Chungke plants - Rooftop Solar Power Generation System (Expected to be operational in the second half of 2025) | 39 | (Under contract construction) |
| Purchased Electricity | Signing of Green Power Purchase and Sale Agreement (Starting from 2025) | 15 | (Application for sub-metering in progress) |
| 2024 Total Renewable Energy Consumption | 121,565 | ||
※Note 1: The New Plant refers to the plant officially put into operation after 2023 (Advanced Manufacturing Center II - Daxin Semiconductor Materials Plant).
※Note 2: RE (Renewable Energy) indicates the proportion of renewable energy.
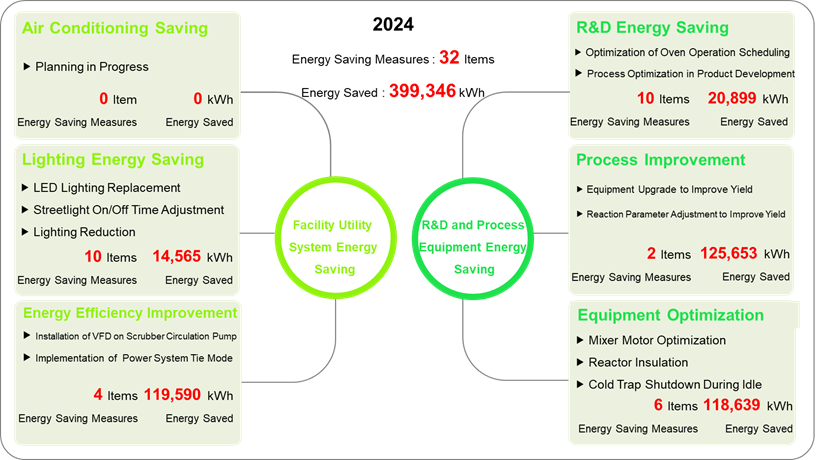
During the reporting period of 2024, a total of 32 energy-saving measures were managed, covering 22 items for utility systems and production equipment, and 10 items for R&D laboratory energy saving (with a total investment of NT$487 thousand). Through various measures such as process optimization (implementation of 13 process reactor insulation projects), plant lighting energy saving (use of LED lighting), and improvement of process equipment efficiency (installation of inverters for scrubber circulating water pumps, etc.), the efficiency of energy and resource utilization in production areas and processes has been enhanced.
This year, due to the implementation of energy-saving measures, electricity savings reached 399,346 kWh, with an annual energy saving rate of approximately 3.0%, achieving the expected annual energy saving target of ≥ 1.5%. At the same time, 197 metric tons of CO2e carbon emissions were reduced, with a total carbon reduction benefit of about 2.8% across all plants. In the future, we will continue to promote energy conservation and carbon reduction actions, moving towards the goal of a 20% reduction in organizational greenhouse gas emissions by 2030.
| 2024 Energy Saving Performance | ||||||
| Plant Area | Electricity Consumption (kWhr) |
Power Saving Amount (kWhr) |
Energy-saving Benefits (%) |
Carbon Emissions (metric tonsCO2e) |
Carbon Reduction Amount (metric tonsCO2e) |
Carbon Reduction Benefits (%) |
| Chungke plants | 5,321,200 | 51,848 | 0.4% | 3,159 | 26 | 0.5% |
| Chungkang plant | 7,562,765 | 347,499 | 2.6% | 3,919 | 172 | 4.6% |
| Total for all plants | 12,883,965 | 399,346 | 3.0% | 7,078 | 197 | 2.8% |
※ Note 1 : The carbon reduction amount is estimated based on the 2023 electricity emission factor of 0.494 kgCO2e/kWh.
※ Note 2 : All plants refer to Chungke and Chungkang plant.
