

ESG
GHG Emission and Energy Management
In 2022, we began addressing greenhouse gas emissions in line with Taiwan's 2050 Net Zero Emission goals. We conducted our first-ever greenhouse gas inventory for 2021, following ISO 14064-1:2018 standards. This inventory covered all emissions sources, both direct and indirect, and was independently verified by DNV.
With this data, we aim to continuously improve our emissions management and reduction efforts. We're committed to responding to both regulatory and customer expectations for carbon reduction. In the future, we plan to systematize our greenhouse gas information management as a long-term tool to reduce carbon emissions.
Our ultimate goal is to lower our carbon footprint progressively, using strategies like improved energy efficiency and cleaner energy sources, as we work towards carbon neutrality and net-zero emissions.
Greenhouse Gas Emissions (Combined for All Plants)
| Scope1 | Scope2 | Scope3 |
| 1448.33 tons CO2e | 5892.61 tons CO2e | 12847.01 tons CO2e |
Based on the principle of materiality, 7 indirect emission sources were screened and included in the inventory.
Upstream Raw Material Transport: 129.75 metric tons CO2e
• This accounts for greenhouse gas emissions generated by transportation vehicles moving primary raw materials from the supplier's delivery location to the production facility.
Downstream Product Transport: 45.33 metric tons CO2e
• This includes greenhouse gas emissions generated by transportation vehicles carrying finished products from the production facility to customers.
Employee Business Travel: 27.55 metric tons CO2e
• This calculates greenhouse gas emissions resulting from employee travel using various transportation modes such as high-speed rail, personal vehicles, and taxis, tracked through the travel system.
Waste Collection and Transport: 11.76 metric tons CO2e
• This covers greenhouse gas emissions associated with outsourcing the collection and transport of waste generated at the production facility to a treatment facility.
Procured Raw Materials: 11,351.44 metric tons CO2e
• This calculates the emissions generated in the life cycle of the top 40 major raw materials and tap water purchased, using the Environmental Protection Agency's announced carbon footprint database as the selection basis.
Waste Treatment: 222.63 metric tons CO2e
• This accounts for greenhouse gas emissions generated by the treatment of wastewater and waste produced at the production facility, including incineration, solvent recovery, physical/cleaning treatment, outsourced wastewater treatment, and wastewater pipeline treatment.
Energy Resource Extraction (Non-Scope 1 & 2): 1,058.55 metric tons CO2e
• This calculates greenhouse gas emissions associated with the consumption of energy resources at the production facility, including diesel, gasoline, and electricity, converted to emissions using the Environmental Protection Agency's published energy resource lifecycle assessment coefficients.
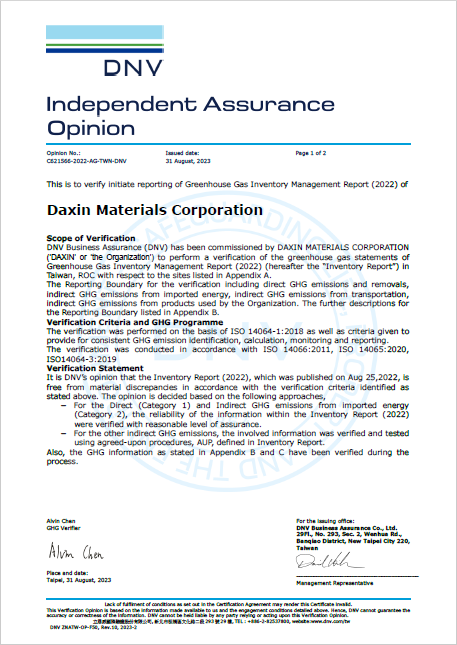
ISO14064-1:2018
Greenhouse Gas Verification Statement
Certification Body: DNV
Certification Date: August 31, 2023
Verified Facilities: Chung Ker Plant, Chung Kang Plant
Verification Year: 2022
Verified Categories: Scope1、Scope2、Scope3
| Scope1 | Scope2 | Scope3 |
| 702.01 tons CO2e | 6358.80 tons CO2e | 8087.9 tons CO2e |
Based on the principle of materiality, 7 indirect emission sources were screened and included in the inventory.
Here are the greenhouse gas emissions from the seven value chain indirect emission sources:
Upstream Raw Material Transport: 301.647 metric tons CO2e
• This accounts for greenhouse gas emissions generated by transportation vehicles moving primary raw materials from the supplier's registered address to the production facility.
Downstream Product Transport: 102.058 metric tons CO2e
• This includes greenhouse gas emissions generated by transportation vehicles carrying finished products from the production facility to customers.
Employee Business Travel: 22.811 metric tons CO2e
• This calculates greenhouse gas emissions resulting from employee travel using various transportation modes such as high-speed rail, personal vehicles, and taxis, tracked through the travel system.
Waste Collection and Transport: 25.386 metric tons CO2e
• This covers greenhouse gas emissions associated with outsourcing the collection and transport of waste generated at the production facility to a treatment facility.
Procured Raw Materials: 6,242.147 metric tons CO2e
• This calculates the emissions generated in the life cycle of the top 35 major raw materials and tap water purchased, using the Environmental Protection Agency's announced carbon footprint database as the selection basis.
Waste Treatment: 231.103 metric tons CO2e
• This accounts for greenhouse gas emissions generated by the treatment of wastewater and waste produced at the production facility, including incineration, solvent recovery, physical/cleaning treatment, outsourced wastewater treatment, and wastewater pipeline treatment.
Energy Resource Extraction (Non-Scope 1 & 2): 1,162.752 metric tons CO2e
• This calculates greenhouse gas emissions associated with the consumption of energy resources at the production facility, including diesel, gasoline, and electricity, converted to emissions using the Environmental Protection Agency's published energy resource lifecycle assessment coefficients.
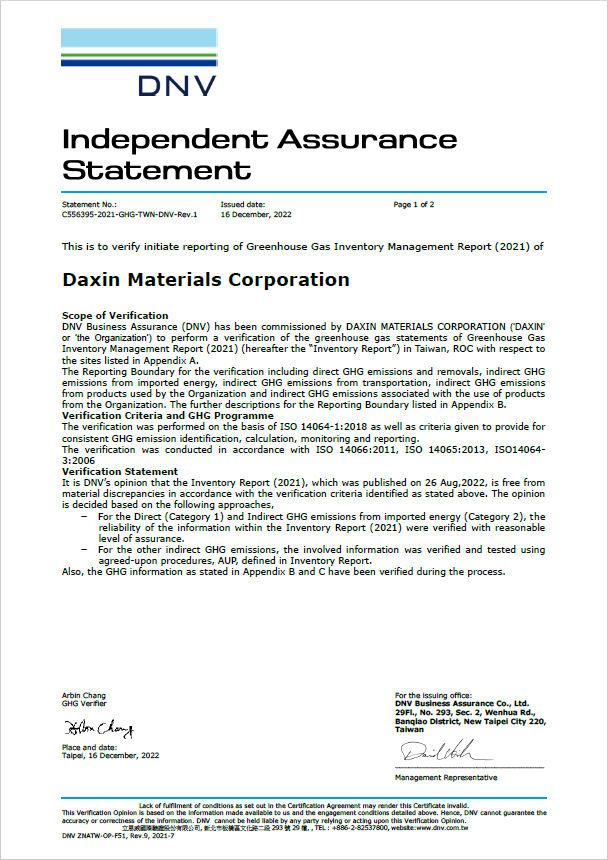
ISO14064-1:2018
Greenhouse Gas Verification Statement
Certification Body: DNV
Certification Date: December 16, 2022
Verified Facilities: Chung Ker Plant, Chung Kang Plant
Verification Year: 2021
Verified Categories: Scope1、Scope2、Scope3
In 2022, we implemented nine energy-saving measures for our commitment to energy conservation and carbon reduction, covering plant systems and production equipment. Through process optimization and equipment management, we improved energy efficiency, reducing electricity consumption by 228,849 kWh/year.
All our production facilities achieved an annual energy-saving rate of about 1.89%, surpassing the 1% target. This effort also led to a reduction of 117 metric tons of CO2e emissions, with a carbon reduction benefit of approximately 1.63%. We remain dedicated to ongoing energy-saving and carbon reduction actions to further lower greenhouse gas emissions.
For more information, please refer to the Daxin Materials 2022 Sustainability Report